Tuning the choice of q (number of clusters) before running spatialCluster
Source:R/qTune.R
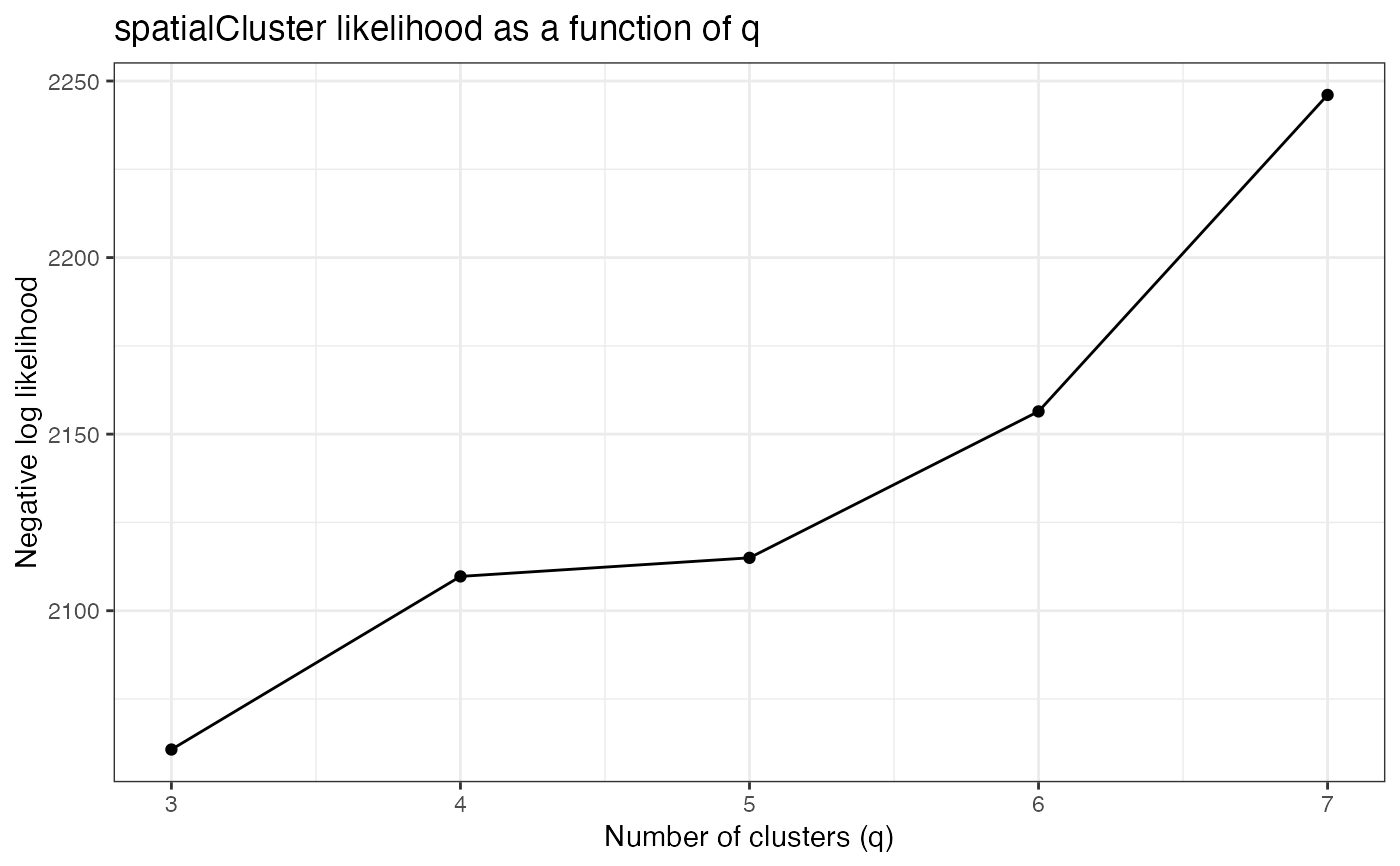
qTune.RdBefore running spatialCluster(), we recommend tuning the choice of
q by choosing the q that maximizes the model's negative log
likelihood over early iterations. qTune() computes the average
negative log likelihood for a range of q values over iterations 100:1000, and
qPlot() displays the results.
qPlot(sce, qs = seq(3, 7), force.retune = FALSE, ...)

qTune(sce, qs = seq(3, 7), burn.in = 100, nrep = 1000, ...)
Arguments
| sce | A SingleCellExperiment object containing the spatial data. |
|---|---|
| qs | The values of q to evaluate. |
| force.retune | If specified, existing tuning values in |
| ... | Other parameters are passed to |
| burn.in, nrep | Integers specifying the range of repetitions to compute. |
Value
qTune() returns a modified sce with tuning log
likelihoods stored as an attribute named "q.logliks".
qPlot() returns a ggplot object.
Details
qTune() takes the same parameters as spatialCluster() and will
run the MCMC clustering algorithm up to nrep iterations for each
value of q. The first burn.in iterations are discarded as
burn-in and the log likelihood is averaged over the remaining iterations.
qPlot() plots the computed negative log likelihoods as a function of
q. If qTune() was run previously, i.e. there exists an attribute of
sce named "q.logliks", the pre-computed results are
displayed. Otherwise, or if force.retune is specified,
qplot() will automatically run qTune() before plotting (and
can take the same parameters as spatialCluster().
Examples
#>#>#>#>#>#>qPlot(sce)