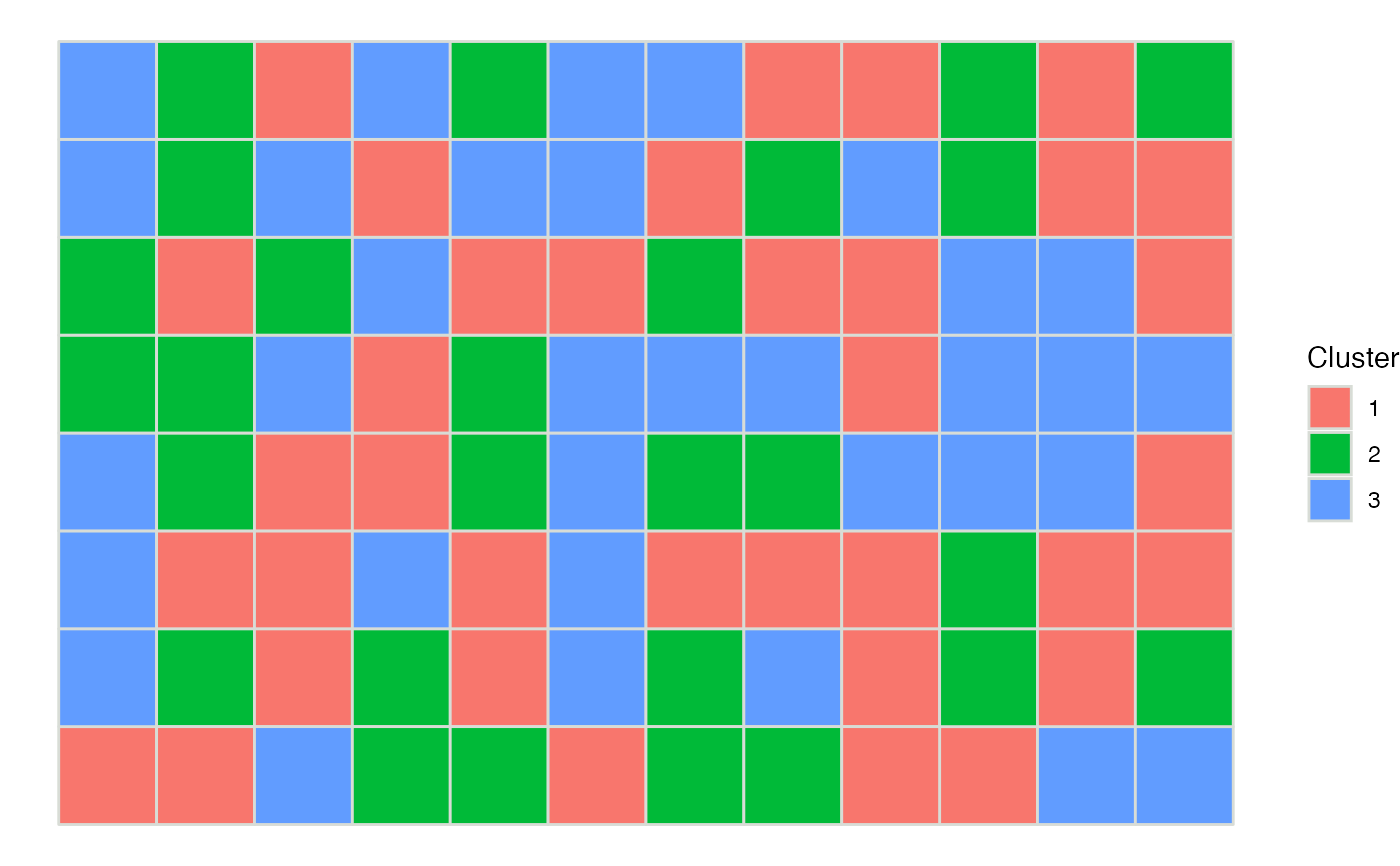
Plot spatial cluster assignments.
clusterPlot(
  sce,
  label = "spatial.cluster",
  palette = NULL,
  color = NULL,
  platform = NULL,
  is.enhanced = NULL,
  ...
)
Arguments
| sce | SingleCellExperiment. If |
|---|---|
| label | Labels used to color each spot. May be the name of a column in
|
| palette | Optional vector of hex codes to use for discrete spot values. |
| color | Optional hex code to set color of borders around spots. Set to
|
| platform | Spatial sequencing platform. If "Visium", the hex spot layout
will be used, otherwise square spots will be plotted. |
| is.enhanced | True if |
| ... | Additional arguments for |
Value
Returns a ggplot object.
See also
Other spatial plotting functions:
featurePlot()