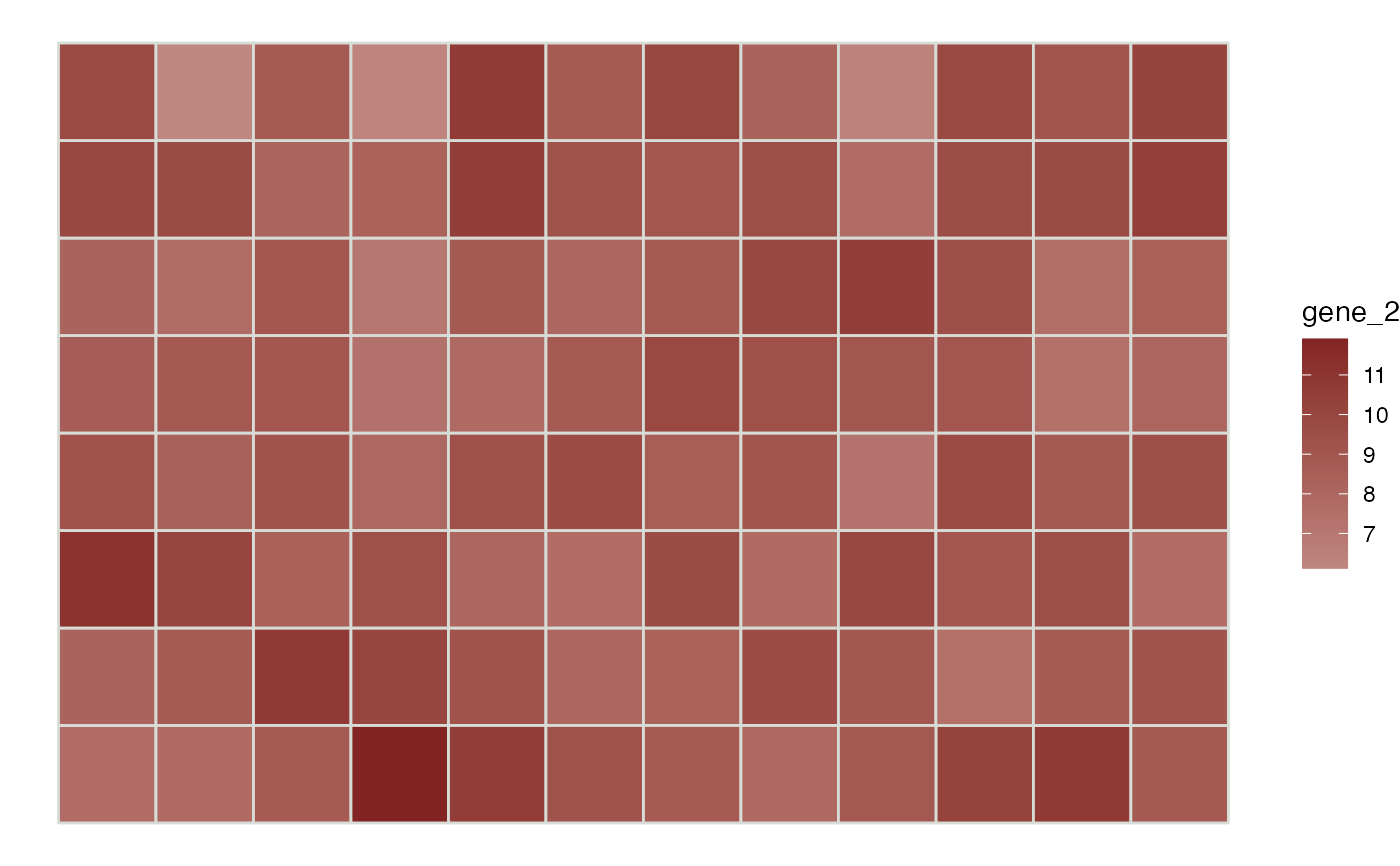
Plot spatial gene expression.
featurePlot(
  sce,
  feature,
  assay.type = "logcounts",
  diverging = FALSE,
  low = NULL,
  high = NULL,
  mid = NULL,
  color = NULL,
  platform = NULL,
  is.enhanced = NULL,
  ...
)
Arguments
| sce | SingleCellExperiment. If |
|---|---|
| feature | Feature vector used to color each spot. May be the name of a
gene/row in an assay of |
| assay.type | String indicating which assay in |
| diverging | If true, use a diverging color gradient in
|
| low, mid, high | Optional hex codes for low, mid, and high values of the color gradient used for continuous spot values. |
| color | Optional hex code to set color of borders around spots. Set to
|
| platform | Spatial sequencing platform. If "Visium", the hex spot layout
will be used, otherwise square spots will be plotted. |
| is.enhanced | True if |
| ... | Additional arguments for |
Value
Returns a ggplot object.
See also
Other spatial plotting functions:
clusterPlot()